Calculating Cost of Algorithmic Trading


In recent years, both market spread and trading commissions have dropped dramatically, as brokers compete to attract customers. But how much do these costs affect the profitability of trading long term?
Relative Market Spread
Effective market spread (as calculated by IEX) is:
Effective_spread = 2*|trade_price — NBBO_mid_price|and gives an estimate for the value you’ll lose per share in crossing the spread with a market order. While (on high volume stocks) the spread is usually no more than a few cents, this can quickly add up when entering and exiting positions frequently.
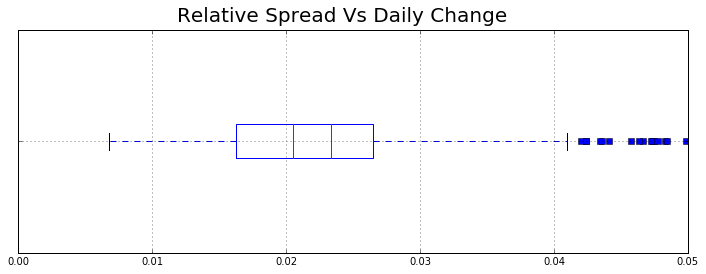
The median spread on S&P 500 stocks is just over 2% of the average daily change, with the mean being 2.3%. While this may not seem like much, if you’re holding trades for a single day close to close, you’d need a P/L ratio[2] of 1.05 just to overcome the cost of crossing the spread to open the trade.
But, the market spread isn’t the only cost to contend with, most brokers also charge a commission on each trade, either as a flat cost or per share. So, how does commission compare to the market spread alone?
Daily and Weekly Trading Strategies
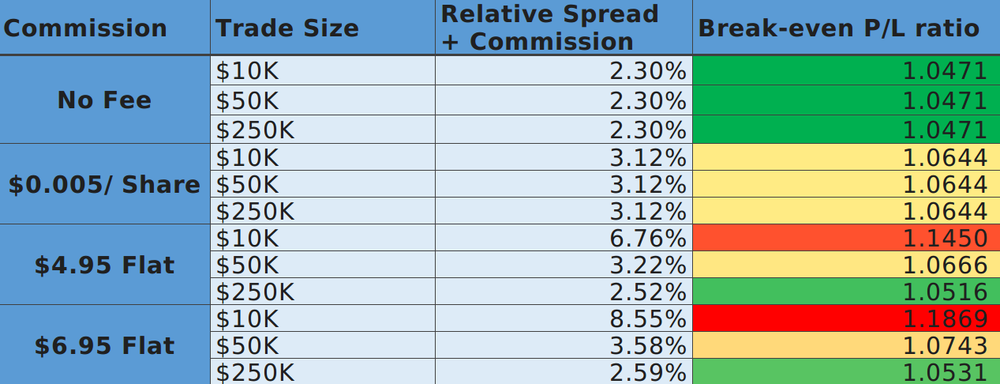
As we can see, trading fees can have a dramatic effect, especially so on smaller accounts, with up to 8.55% of average daily market movement being eaten by each trade in the worst scenario shown.
So, what if we increase the average hold period for each trade from a day to a week?

The longer trading period greatly reduces the relative magnitude of the trading fees, reducing the capital requirements necessary to make lower profit margin strategies viable.
Conclusion
So, while it is certainly possible to overcome these trading costs, especially if your strategy trades infrequently or only during periods of higher volatility, it will still pull down long-term returns, reducing a strategy’s reward for its risk.
Alternatively, you may wish to implement a slippage reduction algorithm to reduce costs by not crossing the spread when possible. This could be done by holding limit orders at the best bid/ask but does come with the risk of unreliable order fills.
Footnotes
- Relative spread is calculated by:
effective_spread = (NYSE_spread + nasdaq_spread)/2.0
# Average daily price movement
mean_absolute_deviation = daily_close.pct_change().abs().mean()
relative_spread = (effective_spread / current_close) / mean_absolute_deviation
2. Profit/ Loss ratio is calculated by.
PLR = total_profit/total_loss3. Weekly bars were calculated as the Friday close of the IEX daily bars
All market data for calculations comes from the IEX API.

Technology and services are offered by AlpacaDB, Inc. Brokerage services are provided by Alpaca Securities LLC (alpaca.markets), member FINRA/SIPC. Alpaca Securities LLC is a wholly-owned subsidiary of AlpacaDB, Inc.
You can find us @AlpacaHQ, if you use twitter.


