Algo Trading for Dummies - Implementing an Actual Trading Strategy (Part 4)


Strategy Development and Implementation
While most strategies that are successful long term are based on a mix of technical and fundamental factors, the fundamental behaviors which are exploited are often very nuanced and vary hugely, so its hard to generalize for an article. As such, we’ll be focusing more on the tools and methods for making strategies based on technical analysis.
Visual Strategy Creation and Refinement
There are many great financial charting tools available, with various different specialties, my personal favorite free option being tradingview.com.
One of the most useful features for strategy creation is its simple scripting language to create both trading indicators and back-testable strategies. While the back-testing tool is rather limited in its functionality, it serves as a good first step sanity check.
Simple creation of trading indicators which are then overlaid directly onto the chart allows for rapid testing and debugging of ideas, as its much quicker to create a script and visually check it against the market than to fully implement and back test it.
This rapid development process is a good first step to making certain types of strategies, particularly for active trading strategies that act on single symbols at a time. However, it won’t do you any good for portfolio strategies or those which incorporate advanced hedging.
For that, you’ll want to create your own tools for visualising full back-tests with multiple trading pairs. This is where the logging features of your back-tester will come in. With the end results being plotted in your graphing tool of choice, such as matplotlib (for Python).
Full Back-tester Framework:
Various plots, such as scatter graphs or hierarchical clustering, can be used to efficiently display and contrast different variations of the back-tested strategy and allow fine tuning of parameters.
Implementing and Back-testing
One of the easiest traps to fall into with the design of any predictive system is over-fitting to your data. It’s easy to see amazing results in back-tests if a strategy has been trained to completely fit the testing data. However, the strategy will almost certainly fall at the first hurdle when tested against anything out of sample, so is useless.
Meanwhile, at the other end of the spectrum, it is also possible to create a system which is overgeneralised. For example, a strategy which is supposed to actively trade the S&P 500 could easily turn a profit long term by always signaling long. But that completely defeats the purpose of trying to create the bot in the first place
The best practices for back-testing a system:
- Verify against out of sample data. If the strategy has been tuned against one set of data, it obviously going to perform well against it. All back-tests should be performed against a different set of data, whether that be a different symbol in the same asset class or the same symbol over a different time sample.
- Verify all strategies against some kind of benchmark. For a portfolio strategy you’d want to compare risk-adjusted returns metrics. For an active trading strategy you can look at risk:reward and win rate.
- Sanity check any strategies that pass the back-test. Where possible, look back over the specific set of steps it takes to make any trading signals. Do they make logical sense? If this isn’t possible (for example with Machine Learning), plot a set of its signals for out of sample data. Do they appear consistent and reasonable?
- If the strategy has gotten this far, run live tests. Many platforms offer paper-trading accounts for strategy testing. If not, you may be able to adapt your back-testing tool to accept live market data.
Once you finally have a fully tested and working strategy which you are happy with, you can run it with small amounts of capital on a testing account. While the strategy may be perfect, there is always the possibility of bugs in the trading bot itself.
Final Thoughts
Creating any effective trading strategy is hard, especially so when you also have to deal with defining it in objective terms that can be converted into code. It can be especially frustrating when nothing seems to produce reliable results. However, sticking to good practices when it comes to the data science of back-testing and refining a strategy will pay off vs learning those same lessons when a strategy under-performs with real money.
By Matthew Tweed
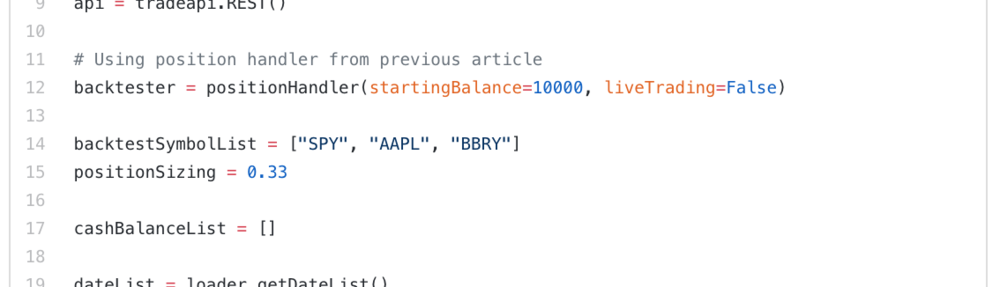
Full back-tester framework:
import matplotlib.pyplot as plt
from datetime import datetime
import alpaca_trade_api as tradeapi
import numpy as np

from positionhandling import positionHandler
import loader

api = tradeapi.REST()

# Using position handler from previous article
backtester = positionHandler(startingBalance=10000, liveTrading=False)

backtestSymbolList = ["SPY", "AAPL", "BBRY"]
positionSizing = 0.33

cashBalanceList = []

dateList = loader.getDateList()

# It can be helpful to have a list of the dates associated with their
# respective bars
timeSteps = len(dateList)
barIterator = 0

while barIterator < timeSteps:
    data = loader.get_data(barIterator)
    for symbol in backtestSymbolList:
        # Historical data input has to be adjusted for your own data pipeline
        # Simple moving average cross strategy
        price = data[symbol]["close"]
        SMA20 = data[symbol]["SMA20"]
        SMA50 = data[symbol]["SMA50"]

        if SMA20 > SMA50:
            openPosition = backtester.returnOpenPosition(symbol)

            if openPosition == 0:
                cashBalance = backtester.cashBalance

                # Calculates required position size
                targetPositionSize = int(cashBalance / (price / positionSizing))

                backtester.placeOrder(
                    symbol,
                    targetPositionSize,
                    "buy",
                    "market",
                    "gtc")  # Market order to open position

        else:
            openPosition = backtester.returnOpenPosition(symbol)

            # Market order to fully close position
            backtester.placeOrder(
                symbol, openPosition, "sell", "market", "gtc")
    cashBalance.append(backtester.cashBalance)

tradeHistory = backtester.tradeHistory
positionHistory = backtester.positionHistory
finalBalance = backtester.cashBalance


# Defines the plot for each trading symbol
f, ax = plt.subplots()
f.suptitle(symbol)

timeList = []
for date in dateList:
    timeList.append(datetime.strptime(date, '%Y-%m-%dT%H:%M:%SZ'))
timeList = np.array(timeList)
# Plots market data and indicators
ax.plot(timeList, cashBalanceList, label=symbol, color="black")

# Add functions to analyse performance over time and calculate metrics


)